There are seven market research steps that every brand and agency should follow to capture immediately actionable insight. This post will help ensure you understand how best-in-class market research looks, and how to ensure that the tool you’re using offers it! Every bit of consumer insight must be wrapped in context, or you’re guessing at its intent and your brand is missing out on the nuanced (and always surprising) global conversation. Without this contextual analysis, your market research is pretty worthless.
Why Accurate Market Research Matters
Simply put, it’s never been more important to be paying attention to emerging trends. Markets are evolving daily in the midst of the Coronavirus pandemic. Industry leaders are relying on market research to keep their brands at the forefront during these trying times.
Quid’s next generation text analysis product mines the global conversations that are relevant to you and your business giving you the edge to stay ahead of the pack.
Accurate market research not only saves you valuable time, it helps you transform market intelligence into competitive intelligence. Now you can adjust quickly and get back to growing your brand.
Step 1: Cast a Wide Net with Your Market Research
Getting started with your market research is as easy as throwing some terms in the search bar and hitting enter. Be sure to note this though – it’s wise to keep your search broad at first. This is important because it will give you some trend analytics that you really must not miss.
Think of it as catching as many fish as you can on the first try. You’re going to get a lot of results. And then we’ll narrow down those results in the next step, effectively throwing back the fish we don’t want.
Why Accuracy & Transparency Matters
Getting accurate results is critical, especially with all the slang and urban terminology out there today – you want to be sure your market analysis is able decipher all of it. For instance, it’s vital that abbreviations – ‘ROTF’ (Roll on the floor), commonly misspelled words such as ‘teh’ for ‘the’ and slang such as ‘sweet’ or ‘tight’ are found, translated, categorized correctly into their proper sentiment bins. .
And what about sarcasm? Yep, your tool needs to be able to understand the sentiment behind this too so a review or social media post that is negative isn’t mislabeled as a positive and ignored, causing a possible PR crisis.
It’s easy to be bamboozled when looking at all the competitive intelligence tools out there – a lot of them look and sound pretty slick! But they aren’t all created equal and some aren’t as accurate and transparent as they would like you to believe. For instance, the ability to see real time fluctuations around your brand is awesome – especially when they come with color coded word clouds and line graphs. But they’re meaningless if you can’t click through to understand why the fluctuation happened in the first place as that is where you’ll find the details of why, and you’ll need it to make a plan of attack for any crisis you may find.
You need to stay updated, checking and rechecking your social analytics for any changes. And this is one reason you deserve a product that can integrate new API updates seamlessly. It keeps your traveling road smooth all the way through to your final destination (consumer conversion), with no serious road construction, wasting time and money. At NetBase Quid, we push updates every few weeks making sure that our analytics are transparent and accurate, keeping you and your brand armed with the best in social listening and market research without any major construction zones to slow you down.
And when the search includes social media (as we’ll see in the Quid Social section below), capturing imagery is important intel to include as well!
Image Analysis Important to Brand Health
How is your brand being represented visually? And who is doing it? Image analysis answers this and more.
This feature not only allows you to see where your brand is popping up in imagery but also what other brands are joining it.
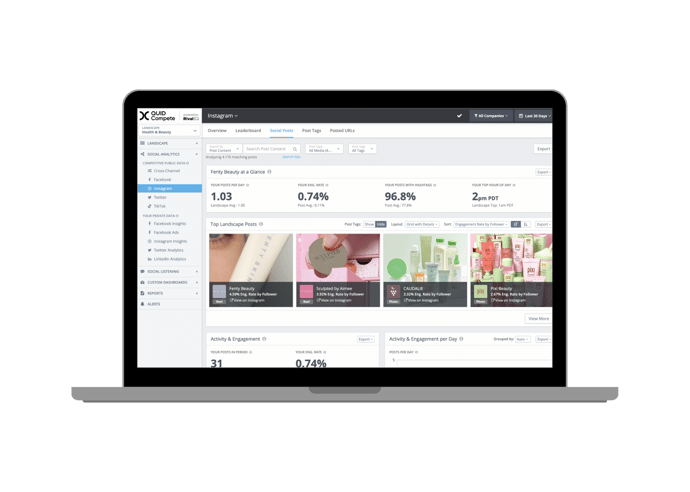
NetBase provides image analytics on Twitter, Instagram, and Facebook, including the ability to read image text to pick up non-logo mentions of your brand.
We have the largest logo library and the highest precision image analytics logo recognition. This is critical for identifying partial, hidden, rotated, and even modified logos to measure brand awareness, drive content impressions, track sponsorship impact or spot logo infringement.
It’s not just logos, you can analyze objects, scenes, and emotions surfacing from a multitude of social media platforms.
And having the option to filter and set the number of filters for image data up to 5 logos lets you compare how your logo is “mentioned” alongside key competitors or brand partners.
There are so many ways NetBase Quid can help your brand, let’s get to it.
Quid enables you to search relevant information in 5 ways:
- News/Blogs
- Companies
- News/Blogs
- Patents
- Quid Social
- Custom text upload
Let’s learn a bit about each!
News & Blogs
The ‘News and Blogs’ dataset pulls in relevant media according to your search terms from August 2013 to the present.
For example, below we have conducted a search around Coronavirus which has pulled information across many industry lines. We see the obvious ones of Healthcare and Technology and also those that have taken a back seat, but are just as valuable, such as Fine Arts.
The search is Boolean capable which naturally lends itself to noise suppression and accommodates filters that you can set to include or exclude Source Countries, Categories and Quality – giving you ultimate control, allowing you to dial in and find exactly what you’re searching for.
Company Dataset
The ‘Company’ dataset enables you to “analyze business descriptions or funding events, track M&A trends, and identify emerging companies.” From operating status, company types and investments – this tool gives you a full picture of a company’s strategy.
And you can uncover additional core information such as venture funds received, founding year and even acquisitions made. This is all done by extracting keywords with the most meaningful expressions and phrases from a company’s description.
Additionally, the search function has tagging capabilities which allows you to better organize what you’re interested in for a clearer and more in-depth view. These could include but are not limited to median or total investment views, acquisitions and even who the top investors are.
And this market research tool is fantastic at storing various types of transactions, transaction amounts, date of transaction, along with other details about the transaction made covering a broad spectrum of events such as:
- Previously mentioned merger/acquisition
- Private placement
- Minority stake
- Public offering
And if you need information on patents, we have a search for that too.
Patents Dataset
The ‘Patents’ dataset enables you to check out trends and understand emerging technologies by searching global patents.
Easily find and locate filings for patents as well as the filing counts within a given category, location of filing and lists of companies (including agencies) or people assigned to them.
Ultimately this function allows a company to stay on top of trends by giving them an inside view of what’s in the works before anyone else knows, providing them early access to whether a patent has been approved or is still pending.
Having this information is handy but without understanding what consumers are wanting, you could be wasting your time, which is why Quid Social is the perfect partner.
Quid Social
Quid Social takes the guesswork out of reading consumers’ minds! Sourcing insight from social media platforms like Facebook, Twitter, Instagram, Tumblr, blogs, forums, news, consumer reviews, and much more
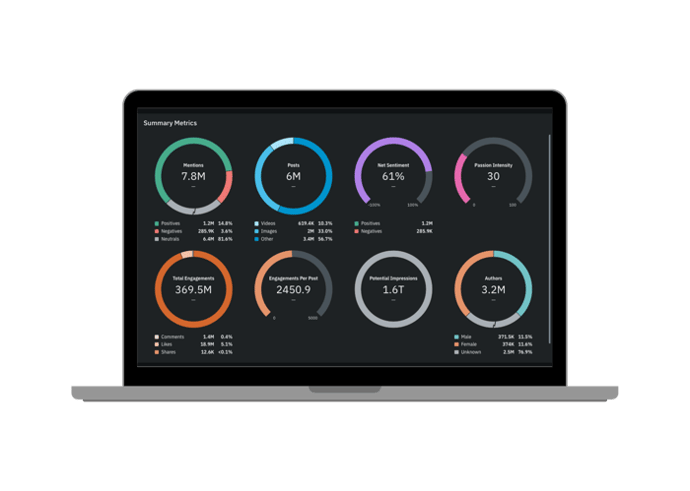
With AI-powered, short text-optimized clustering that you’re used to with Quid’s market research, Quid Social creates a visual network which represents top trends, themes and conversations happening on consumers’ top social media apps. The special ingredient is NetBase, an industry leader in social listening bringing trustworthy results and data that your company can leverage. This means you can dig deeper into consumer insights combining social media with existing Quid data sets allowing your company to:
- Gain access to real-time social media data, making your business capable of faster decisions and responding properly to time sensitive issues, such as trends or crises.
- Understand metadata by viewing engagement metrics and authors demographics that could critically impact your business and brand perception.
- Dramatically improve brand loyalty and all over presence in known, and unknown, markets by locating white spaces, or areas of high social engagement but low publish counts.
Quid OPUS – Custom Text Uploads
If the options above aren’t capturing the specific intel your brand needs, our custom text upload page lets you upload your own text-based dataset for analysis!
Quid has the capability to analyze your unstructured and custom data such as customer reviews, online forums or tweets. If you have a .csv file with 15,000 rows you are in business!
And we currently provide support for many different languages such as English, German, French, Italian, Spanish, Chinese, Korean and Japanese, making this function internationally loved.
It’s super simple to do with just a click of a few buttons – Click New Project and then Upload by dragging and dropping into the selected area.
This tool also supplies advanced mapping alternatives and the option to select your industry and dataset, which will extract more relevant metadata to your analysis.
Once you have dialed in everything you need, hit analyze and watch as your screen produces real-time results.
So, now you put in your topic and have a gazillion search results. Don’t worry, there’s a fix for that.
Step 2: Narrow Your Market Research
It’s important to search broadly at first so you can see things in the market conversation that you might not have thought of. The AI powering this search takes your results beyond what you may expect. And this is yet another reason why market research in Quid is so crucial.
To narrow your results, we should stop to thank George Boole for creating the Boolean search.
If you haven’t heard of Mr. Boole before, he’s the logistical mastermind behind the (AND, OR, and NOT) that we will use to narrow your market research to something actionable. Using these keywords within the search bar can further narrow down your results to help you focus on what’s important.
This step is where you narrow down your conversation and get to what you really want – and need – to know. Using Boolean keywords in Quid is what helps us to narrow down from millions of search results to around 10k. That’s powerful market research for any brand!
10,000 results. That’s your magic number for relevancy. If you’re above that, add in some keywords to narrow down your search. At this point, you’ve boiled your topic down to maximum potency, and are ready to discover next level insight to inform your efforts.
Step 3: Discover Your Market Research
With next generation AI capabilities at your fingertips, the global conversation important to your brand is just a click away, as Quid helps you make the necessary contextual connections to make the most of your market research.
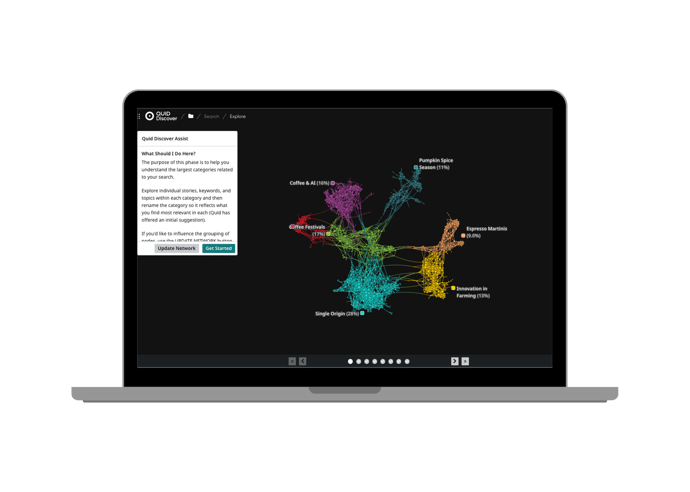
Once you hit “visualize,” conversational clusters emerge in a data visualization ready
With so much insight available, let’s explore each option in turn:
Market Research
This is a combination of news media from variety of sources (as defined in News & Blogs description above) and consumer insight to better understand not only the market, but the voice of the consumer.
Without understanding the voice of the consumer, you may as well be flying blind. This is why we use next generation AI to provide deep and actionable insights about your consumer and their feelings on their customer experience. Also provided is information on purchase intent, competitive preferences and more, funneling it all into a single platform to help fuel your company and business.
And since it eliminates costs and human error from manual data collection you can trust the results. It offers improved business outcomes, with a more intimate understanding of the customer experience and how everything works together.
Consolidating consumer information in NetBase Quid creates a unified view of your customer. Without visibility across all data silos, your view is limited. Not to worry, our tool aggregates and normalizes all customer information smashing all information silos and misalignments. This results in consistent customer insights to guide your team toward focusing on top priorities. And it makes your business more agile and better positioned to make strategic decisions. It also:
- Supports stakeholders on priorities with a single source of truth for all customer experience programs
- Helps companies understand customer satisfaction scores and key performance indicators (KPI) in real-time
Voice of the Customer delivers greater support and clearer insights informing every part of the enterprise, including Marketing, Sales, Customer Care, Operations, and Product Development.
This all comes together to improve brand health and boost campaign performance as well as lower customer care costs. All in all, it provides better customer engagement so that you can respond to crises in a prompt manner.
And statistically, companies with Net Promoter Score (NPS) programs report 30% growth rates, outperforming the market. It helps turn passive consumers into promoters by understanding the driving opinions. With it, brands get a handle on:
- Uncovering themes, topics and emerging trends discussed by customers
- Understanding the root cause analysis so Care Agents can reduce average handle time with consumers and increase satisfaction.
- Pinpoint areas for improvement by analyzing agent response
- Fixing product and service problems by measuring customer satisfaction and sharing with key share holders
- Understanding the “why behind the buy”
The Why Behind the Buy
The VOC is the heartbeat to your business. Understanding what is driving your consumers to buy is critical to campaign strategy and informing you on your next product or advertisement.
Deliver localized buyer insights with richer stats about sales and responses. You can integrate with Salesforce, Pipedrive, Zoho, Siebel, SAP CRM, Oracle CRM, Nimble, Pipeline Deals, and more to reach customers with consistent personalized content throughout their purchase journey. By understanding top themes and areas where expectations are not being met, you can improve the CX experience and monitor customer sentiment which helps to predict a customer’s likelihood to buy again.
And not least of all of the VoC capabilities revolved around protecting a brand’s digital reputation. 90% of customer buying decisions are affected by online reviews – digital channels should be a priority for any business to understand and influence. NetBase integrates with Google Reviews, Yelp, Bazaarvoice, CNET, Trip Advisor, Amazon, Metacritic, Glassdoor and many other to help you gain perspective and real-time reads of reviews and sentiments. These items inform your brand and allow you to measure changes within your marketing campaigns.
Once you’ve grasped what is being said, you can steer the ship and focus conversations on brand topics you’d like to highlight, and use loyal customers and influencers to do it!
From discovering most discussed topics for your brand or industry to tracking customer interactions over time, voice of the consumer can be a pivotal and powerful tool to have. Customer feedback is a valuable asset to have no matter what form in comes in, of course – from social platforms like Facebook to online reviews. It all informs your brand to make better decisions and drive successful market strategy. chat logs, support forums and more!
Market Analysis
With so much consumer and market search on hand, brands have limitless options to extract relevant, immediately actionable insight. One way is to identify ‘first mover’ opportunities.
Being the first to release a product of its kind or improve upon something can be the opportunity to boost your brand to superstar status.
Locating trends that are building with high social engagement, but low publication numbers are ideas that resonate with consumers – which is everything a brand wants. We call these areas white spaces and it’s a way to identify potential products or services that are wanted by consumers and aren’t being found at the moment. No brand wants to miss an opportunity to be first.
Below is an example of one our tool’s functions – the Scatterplot. This tool is handy for identifying white spaces. Here, we see that Oil and Gas Companies See Opportunity in Offshore Wind Energy is experiencing significant engagement, but low in published articles. This could be an opportunity for those wishing to invest or create their own option ahead of the rush to market.
Having a clear visual map to see opportunities is priceless – especially when it’s used to place your company into the first movers club. And data visulziations offer that.
Data Visualization
Data visualizations are the most effective way to read market research. They help companies get to the meat of what they need, through multiple views and applied filters.
To begin, you create your target subject and search. Results will appear in the form of clusters which represent different segments of conversation that encompass your chosen topic. Here, ours is sustainability. Each cluster holds previously hidden conversations by companies and even information on inventions, making them digestible to the viewer.
The size of node represents the number articles published so the larger the nodes, the more active they are as they share more links in common. Clicking on these reveals articles which you can click through to investigate, demonstrating how various articles are dominating the conversation.
Bar Chart
Another great way to break down the information is a Bar Chart. A bar chart shows visual and numerical ranks of the clusters and allows you to filter them by investments, people, and companies.
Here, we have a search around the pandemic. And we filtered it to show top people mentioned which can give us an idea of the key opinion leaders (KOLs) on the scene as well. We’ve also fixed this view to show the number of articles within each color-coded segment.
For example, Jeff Bezos is dominating the segment Due to Covid-19 and isn’t mentioned elsewhere, while President Trump is mentioned across various segments, the largest being White House.
You can also restack your bars according to social sharing to help see what is trending.
Timeline
And if you would like to see how conversations play out over a selected period of time, then the timeline view is for you.
This option creates a timeline of conversation around your topic – illustrating the evolution of it. It shows whether events persist or die out over time, and how the conversation plays out from a social perspective. It also reveals whether or not news outlets echo those sentiments.
It can be filtered to show top companies mentioned, as seen below in our timeline view of quick serve restaurants. We see that McDonalds clearly dominates throughout the past year. And in June, we see a bit of a larger spike for KFC – one that wanes a bit only to come back stronger in August. However, in October it’s not even mentioned.
Scatterplot
And one of the most valuable tools is the scatterplot, showing the who and how of conversation as well as how it’s all being received. Filters are the heart of this visual as they can be set to show media count compared to social engagement, which gives you an idea of what is resonating with consumers vs what is being said in popular media. You can also do a company view to get a bigger picture on who is trending and why.
Below, our scatterplot shows that Popeyes spicy chicken sandwich is resonating with consumers from its high publish count as well as it’s engagement, meaning it’s winning in consumers’ eyes and with the media.
Histogram
This shows a distribution of articles by location, sentiments and many other metrics, including social sharing. So, not only can you see what’s trending, but also how its being perceived.
The histogram shows that Pay Workers and 7 Fast Food Restaurants Open are capturing more social engagement, even though topics such as Fast Food Restaurants and Favorite Fast Food Restaurants have a larger share of voice via media news outlets. This highlights that what’s trending in news isn’t always what’s trending with consumers. And this shows why you need both social listening and market research to have a well-rounded view of the market for your next campaign strategy.
Tagging or Searching in Network
Once you’ve created your search, you can then search deeper for a specific subject and view how it intersects across the clusters and segments with tagging. Maybe it’s a company or specific people or mentions, with the searching function, something that should take hours is revealed in seconds. You can see what we mean is our graphic below.
We searched to see how different quick serve restaurants were being represented within a conversation cluster and it’s clear that our tags for McDonalds and Fast Food in general are largely being discussed.
Now you know the who, what and where, but what about the over all feeling of consumers and the sentiments that go with it?
Language Analysis
Netbase analyzes sentiment by examining insights from emotions, behaviors, likes or dislikes – all in one sound bite. It then classifies it as:
- Positive – such as “I really like my new Nikes because they’re well made” or “Amazing!”
- Negative – sentiments expressed such as, “Kentwood Water is too expensive and has a slow delivery time”
- Mixed – this expresses both positive and negatives sentiments. A mixed sentiment soundbite may contain one positive and one negative towards the total analysis. For example, “I love Target for it’s clothes but their selection on other products seems too limited.”
- Neutral – This means the soundbite either contains no sentiment or that it contains no sentiment towards the primary terms searched. Example: “I’m like my mother, I place the Charmin toilet paper roll facing outwards.”
And sentiment precision is so important and can be controlled by setting a topic option to control different precision levels – high or medium. You can also extract sentiments based only on a topic’s primary terms or on all sentiment. Or you can override a topic’s sentiment focus all together depending on your unique use case by dismissing channel, geo-fence, image based topics or VoC.
Understanding sentiments aids a brand in knowing where they are hitting the mark or missing it. Sometimes however, it can be confusing to decipher especially with the evolution of language to fit the digital era. For example, abbreviations used on social media like LOL or ROTFL can trip up some analytic tools, and reading sarcasm can be a complex issue as well, but NetBase uniquely translates these language barriers.
Grammatical analysis is a must if a brand hopes to decipher everything being said. Most Language Processing technologies focus only on sentence tone. But, NetBase surfaces and analyzes sentiment for every subject in the sentence. As an example:
Both sentences include the word “good,” it is clear to a human reading this that the first sentence expresses a negative opinion about the iPhone while the other expresses a positive opinion. Our language processing understands the subtle differences between sentences and uses this knowledge to precisely classify and obtain insights from conversations.
In addition, it can:
- Read and interpret the meaning of consumers’ social media posts with accuracy.
- Analyze data based on all of the variations that may occur in over forty different languages.
- Process misspellings, sarcasm, and emojis to extract information and sentiment. Such as:
- Urban words or “slanguage,” for example, “My new shoes is sick!”
- Alternative spellings, for example, “luv,” “kewl”, or “gr8”
- Abbreviations, for example, “IMHO,” “ttyl”
- Common misspellings, for example, “teh/the”
Key Opinion Leaders (KOL)
So, what about finding the experts in any field or Key Opinion Leaders (KOL)?
Quid helps to identify these influential people and ranks them within any given topic area. You can use a KOL search to find most mentioned people, companies or organizations, and even view whether a KOL is perceived as positive or negative.
It also discovers emerging KOLs to keep your eye on, or key KOLs to help launch your next campaign or fuel your next research project. It’s powered by advanced data science technology and summarizes key themes for you to zero in on and explore as well, keeping you informed on upcoming trends.
And you’ll want to be sure that you’re analyzing those trends accurately….
Trend Analytics
Consumer data can be overwhelming, and this is where having trusted competitive intelligence plays savior. Between all the social and news media sources there is a treasure trove to be mined and helping you on your way are Netbase Quid Trend Analytics.
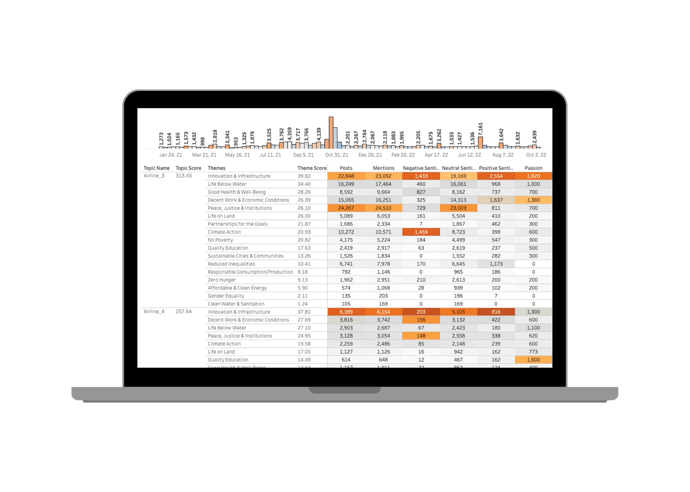
This functionality helps brands build a meaningful trend analysis by visualizing major market trends and pinpointing specific opportunities and niches your company can explore and fill. And you can do this by analyzing and tracking conversations pertaining to your brand, visualizing vast topics for marketing and monitoring trend shifts in real time. Brands can see actual visual spikes in sentiments from consumers, as well as tracking their share of voice in the market currently and over time.
And it’s not just your brand you can monitor but competition as well. Watching your competitors’ consumer conversation is a great way to find unmet needs that you can swoop in and provide.
Or you can see how they’re responding to macro trends. The strategic angle of this tool can expand your view of how trends are affecting you and the market so you can adjust your messaging and strategies in a timely fashion, staying ahead of the race.
Media Analytics
Media Analytics shouldn’t be complicated to read or understand. First, decide on a topic and load your analysis. Click directly on Storylines Overview lens and it will divide the information into digestible chunks, color-coded for easy visualization.
From here you can choose to break down the events into types, allowing you to pick out which of them generates the most media over your customizable time period. You are also able to read sentiment and traction from the same view, enabling you to see which events garnered the most social media attention, as well as associated positive or negative language.
Another neat feature is the Reporter Filter. This option allows you to see top people by mention. Here, we have a reporter’s view in a search that is about Quick Serve Restaurants. We can see which restaurants are being spoken of via the color chart, and by whom.
Also accessible is the article count which gives us an idea of share of voice. For example, Erin Mcdowell’s top six stories are about McDonalds, with the last two covering Taco Bell and quick serve restaurants in general. While Jeanette Settembre’s coverage is spread throughout several segments, though lower in count.
And for a cherry on top, you can export your findings to easily drop into your proposal or research material.
Regardless of the type of information you seek, you’ll be presented with clusters of data to explore. And you can merge similar ones and delete those that you find irrelevant:
Don’t be too hasty though! There’s a lot of data that gets pulled in that can help give insight into emerging trends. Important insight could be the “one that got away,” so be sure to explore the conversational clusters in full before going back to delete/merge as needed.
The colored bubbles in the data map are “nodes.” Each one represents a piece of insight – an article, a piece of company intel or patent description, depending on your search criteria.And these nodes can be recategorized and manually moved to other clusters as well.
You can also influence the grouping of nodes, by using the UPDATE NETWORK button (shown below) to regenerate a network with boosted words, blacklisted words, and other adjustments:
And from there, you can analyze your market research to see what insights are hiding beneath the surface.
Step 4: Analyze the Market Research Conversation
After you’ve narrowed down your market research, click the analyze button to see a wealth of graphics to sink your teeth into.
From the ever-evolving Network map of clustered data, you can look at data visualization broken down in many forms so it’s easy to digest.
You can also look at top clusters relating to your search, top company metadata, traction, timelines, and sentiment. Once you find the data you need, Quid enables you to boil down your dataset to serve you up insights and intelligence.
There is an unexpected level of customization available here – one that will exceed your expectations and support a variety of use cases. Quid helps you anticipate market trends by narrowing down your focus on the things that are relevant to your brand and larger category. And it helps you answer tough questions around identifying emerging tech, adjacency opportunities and key opinion leaders; gathering competitive intelligence; vetting potential partnerships; and, so much more:
But merely identifying it isn’t enough – exploring it in context and creating a narrative that suits your needs is where most other tools leave you high and dry.
Step 5: Outline the Market Research Story with Conceptualized Understanding
You’ve merged clusters and moved nodes as needed, and you’ve explored the many ways to slice and dice the data. And you’ve captured views that help you frame this new expert understanding you have of the global market; in whatever niche you’re exploring.
As you analyze the insight, you can save views of each, along with corresponding news/stories that are informing the intel. This enables brands and agencies to use market research to its full, and awe-inspiring, potential.
It’s one thing to understand which companies are capturing conversations but understanding the “why” behind is a game changer.
And this is possible with each type of search – blog/news; companies; patents, as well as your own uploaded data.
Step 6: Report Market Research Results with Powerful Data Visualizations
Once you’ve captured the information that you want, you’ll want to create a report sharing these visualizations, with clients or colleagues. The ability to export your ‘saved views’ directly to Microsoft PowerPoint or present on screen is key – and why we’ve made it so simple to do so.
Just click ‘export’ or ‘present’ for whatever views you’ve saved to populate.
Step 7: Monitor Market Research for New Trends
Complacency results in companies closing. The market is always at your back and it’s your job to stay ahead of the pack with – you guessed it – market research! We help you do that too.
It’s important to note that you can also update your search, using the same or modified criteria, to capture different date ranges, a slightly (or more majorly) different focus, geographical or information source preferences and many other ways as well.
For example, in the “news/blogs” view, users have filters around the publish date, source country, source quality and source category. And in the “company” view, we see a wide variety of potential info around public and private companies, including funding events, types of investments, intel on investors, acquirers and owners, and where in the world this is all happening – and when.
Last, but not least, the “patent” view offers an array of options as well, from when it was first filed, its designation, status, who invented it – and in every single search there’s corresponding insight connected to it that offers additional elaboration.
The market changes daily and your search criteria is likely to shift significantly over time. This is a good thing, as it will help your business stay nimble in a landscape where sure footing is non-existent, and the only constant is change.
Save your searches in Quid to keep your market strategy in focus. Stay in the lead! Jump into our resource center for more information. And be sure to reach out and let us help you level up your market research strategy!